
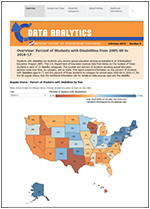
 A new online interactive report, Percent of Students with Disabilities by Disability Categories for 2005-06 to 2016-17 (Data Analytics #8), shows the number and percent of K-12 students receiving special education services from 2005-06 to 2016-17, both nationally and for the 50 regular states. Viewers can select a number of different ways to look at the data in this report. A color coded map shows the variation in the percentage of students with disabilities by state. It can be customized to show data for a particular year. Additional graphics allow the viewer to compare the percentages of students with disabilities over time in different states and to examine the percentages of students in specific primary disability categories.
The special education data come from IDEA Child Count and Educational Environment reports and total student enrollment data reported by the National Center for Educational Statistics.